Modeling UK National Railway Network
The focus of this research is on national level rail models and their assignment approaches. Currently, different models are used to inform decisions made at the national level such as the Network Framework Model (NFM), the National Transport Model (NTM), and the PLANET Framework Model (PFM). These models take different approaches to modelling rail and are consequently developed using different software platforms utilizing different assignment approaches. This research will look into developing a framework for modelling national railway network using PTV VISUM, and demonstrate its use via the subsequent analysis of rail demand and network connectivity.
Model Development
(1) Demand and Zoning
The usual process for deriving rail demand data begins with the LENNON ticket sales database, from which the data is processed and converted into an origin-destination matrix. However, the LENNON database is lacking with respect to trips made using travelcards, PTE sponsored trips, and trips to/from airports. This project sources the demand data from MOIRA 2.2, which has the following format:
Origin
TLC
Destination
TLC
Ticket Type
Annual NR Journeys
(1st class)
Annual NR Journeys
(Standard)
In the UK, tickets can be purchased that allow a traveller to travel to and from a "station group". The inclusion of station groups in the dataset causes a problem as the demand to and from these stations needs to be allocated between them, giving rise to an extra processing stage.
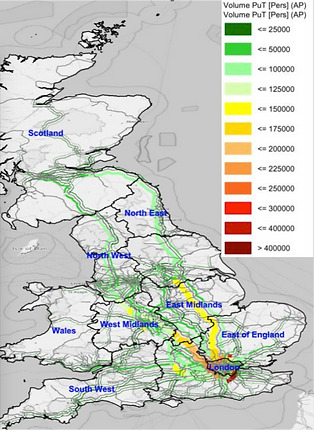
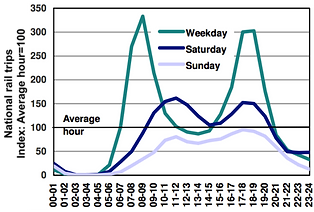
Fig. 1. Volume of NR trips by hour and day of week. Source: DfT (2014a)
(2) Time Reference of Demand
It is necessary to specify the temporal distribution of OD demands, as they do not remain constant throughout the day. Generally, the time-varying demand can be accounted for in models by specifying separate OD matrices for each time interval, which is data intensive - especially for large networks such as this - so a percentage allocation method was pursued. The percentage allocations were adapted from the Rail statistics factsheet (DfT, 2014a), specifically, from Figure 1.
(3) Railway Network Supply
The main source of the railway network are Ordnance Survey and the Asociation of Train Operating Companies (ATOC). ATOC produce a Google Transit Feed Specification (GTFS) file, which can be imported into VISUM and contains details on stop locations, stop points, lines available, operators and the timetable of services. When imported into VISUM, the GTFS file does not provide an accurate representation of the rail network as it only provides a schematic network with links representing connections between stations rather than actual railway tracks (see left of Fig.2). A more accurate network is needed and provided by Ordnance Survey Strategi data. The two datasets are combined into VISUM via the use of a script called PuT Importer that utilizes map matching algorithms to transfer supply information such as line routes, lines, time profiles and vehicle journeys from one network to another. A coordinated use of manual match of stations and detour test guarantees that the map matching is error free, and the final network is shown on the right of Fig. 2.

Fig. 2. Left: the initial GTFS network. Right: the final rail network
(4) Assignment
The model uses a timetable-based assignment instead of headway-based assignment, as there are services with headways greater than 15 min (a maximum threshold recommended by DfT, 2014b for headway-based assignment), and the timetable of services is complex. There are three main steps in the assignment procedure: (1) path search; (2) path preselection; (3) path choice.
The path search employs the Branch and Bound method with "search impedance" defined as a linear combination of In-Vehicle Time (IVT), Walk Time (WT), and Transfer Wait Time (TWT). Further culling of unsuitable paths occurs in the preselection stage via the use of exclusion rules applied sequentially. Finally, the path choice is modeled through "path impedance" (disutility) expressed via IVT, TWT, Origin Wait Time, Number of Transfers, and Early/Late Departure Penalties, where the coefficients suggested by DfT (2014b) and Wardman (2013) were used.
The path impedance is then fed into a choice model that allocates a proportion of the demand between zones to each connection for a given time interval. Here, we have used a Kirchoff model in the assignment as opposed to a logit model as it uses ratios rather than differences between impedances to distribute demand. This allows it to produce a more realistic assignment with regards to longer paths. Here, a parameter (high, medium, low) is used to measure the sensitivity to path costs, as we do not have the resources to directly estimate it using observed data from surveys.
Results and Discussion
(1) Assignment Results and Comparison
Fig. 3 shows the passenger volumes on each part of the UK railway network. The general trend that can be observed from all 3 modeling scenarios is that the highest levels of flow occur in London and towards London, particularly around the central London termini. Other areas of the UK see relatively low levels of flow. We can see that a significant proportion of trips towards the central London termini comes from the West Midlands, North West, and Yorkshire and the Humber. The London Midlands service from Birmingham to London Euston accommodates the largest proportion of the demand from the West Midlands followed by the Virgin train service from Manchester Piccadilly to London Euston whereas the Great Northern service from Leeds to London King's Cross accommodates the most demand from the East Midlands. Generally, flows into London coming from the north use these services alighting at London King's Cross, London Euston or St Pancras International. This behavior is affirmed by the results from TfL's central London termini survey results (TfL, 2011).


High Sensitivity
Medium Sensitivity
Low Sensitivity
Fig. 3. Rail usage by passengers for a typical weekday (click to enlarge pictures)
Fig. 4 shows comparisons between the assignment results for the high and low, and high and medium sensitivity cases. It can be seen in both pictures that approximately 15,000 passengers change route from the London Midlands Birmingham to Euston service to the CrossCountry Birmingham to Guildford service, entering into the central London termini through Clapham junction and then Waterloo. This shows that although the London Midlands route may be more convenient (has a lower impedance), there are reasonable alternatives that passengers can take. On the other hand, trips toward Kings Cross


High Sensitivity-Low Sensitivity
High Sensitivity-Medium Sensitivity
Fig. 4. Comparison of rail usage on a typical weekday between high and low sensitivity cases (click to enlarge pictures)
(2) Rail Connectivity
Fig. 5(a) shows the number of departures from each stop on a typical weekday. London, and the areas surrounding it, enjoy a relatively high frequency of service. Cross-referencing this figure with Fig. 3 shows that the areas of low departures coincide with the areas of low passenger flow. Further analysis into transfer wait times, as shown in Fig. 5(b), reveals that the stops with large transfer waiting times all happen to be in relatively rural regions. Major conurbations such as London, Birmingham, Manchester and Edinburgh experience low average levels of transfer wait times. Cross-referencing with Fig. 5(a), we can see that these stops happen to be in areas with low levels of departures - in particular the South West and East Midlands regions. This givens credence to the notion that as well as having low levels of departures, they are not coordinated with other stops in the rail network significantly reducing their connectivity.
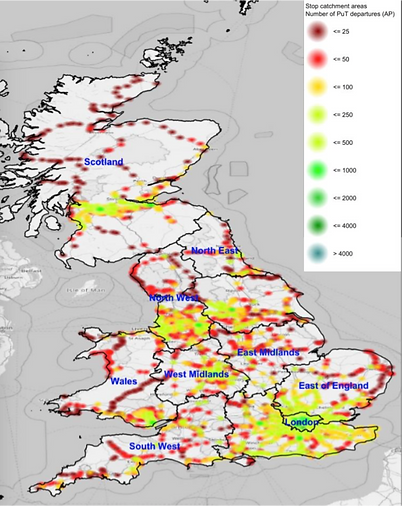
Fig. 5(a). Number of departures from each stop on a typical weekday
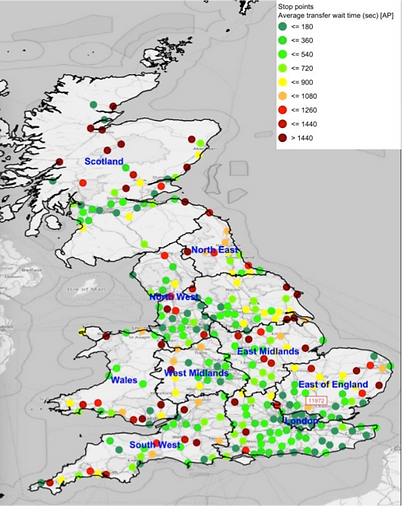
Fig. 5(b). Average transfer wait times at stops (low sensitivity model)
Content displayed on this page was cited from the following source. Full copy available upon request.
Abdulfatah Abu (2017) Modelling and Analysis of UK Rail Demand Using VISUM. MSc Dissertation, Center for Transport Studies, Imperial College London. Supervisor: Ke Han.
References
DfT (2014a) Rail Trends, Great Britain 2013/14: Rail Statistics Factsheet. London. [URL]
DfT (2014b) TAG Unit M3.2: Public Transport Assignment. London. [URL]
TfL (2011) Central London Rail Termini: Analysing passengers' onward travel patterns. London. [URL]
Wardman, M. (2013) Value of Time Multipliers: A Review and Meta-Analysis of EuropeanWide Evidence, Transportation Research Board. London.