London Bike Sharing
London's Santander Bike Sharing System (BSS) offers sustainable solutions to urban transport by creating a clean and healthy environment, which not only facilitates local, short-distance travel, but also offers last-mile connection to public transit systems. Fig. 1 shows the shared bike flow pattern on a typical working day in London.

Fig. 1. Shared bike flows in London (links are shown between two stations only when the number of bike trips is no less than 4)
There are more than 500 docking stations in the London BSS. Depending on their geographic location and nearby land-use characteristics, their bike pick-up and return profiles vary greatly. Applying time-series clustering to the pick-up and return profiles, we can characterize these stations into three types: red (residential-like); yellow (work-like); and blue (mixed). See Fig. 2.


Fig. 2. (a) Centroids of the three time-series clusters. (b) Clustering of the bike stations by pick-up and return profiles.
Having seen when the bikes are used, let us now look at how they are used. In places like London, the shared bikes may be used for direct commute (point-to-point or last-mile) or leisure. In the latter case, the actual cycling time is typically larger than what it takes to go from the pick-up station to the returning station on a shortest route. By comparing the actual and shortest cycling times, we are able to derive a duration index, which, on the lower end, indicates that the bike trips are mostly used for direct commute, and on the higher end, for leisure. The duration indices for all the docking stations are shown in Fig. 3. How many popular pro-cycling spaces in London can you identify?

Fig. 3. The duration indices for all the bike stations in the London BSS.
Finally, let us see how the bikes are circulated within the city. Without tracking the bikes' IDs, this can be done via the community analysis. In short, a community structure refers to a partition of all the docking stations such that stations within the same community are more likely to be connected (via bike trips) than stations in different communities. Fig. 4 shows, in a 24-hr horizon, the community structure of the London BSS. Since the majority of the bike trips occur within the same community, a single bike is more likely to be circulated in the same community. This offers some insights regarding the re-balancing and re-positioning of bikes in the city.

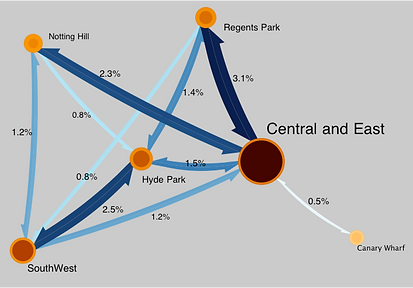
Fig. 4. The community structure of the cycling network in London BSS. The inter-community flow accounts for only 15.3% of the total bike flow.
Content displayed on this page was cited from the following reference:
Munoz-Mendez, F, Jeammaneeporn, P, Han, K, 2017. Understanding and visualizing London shared cycling patterns using machine learning and network analysis. Transportation Research Board 97th Annual Meeting. Washington DC, Jan 2018.